XR Analytics vs Traditional Analytics
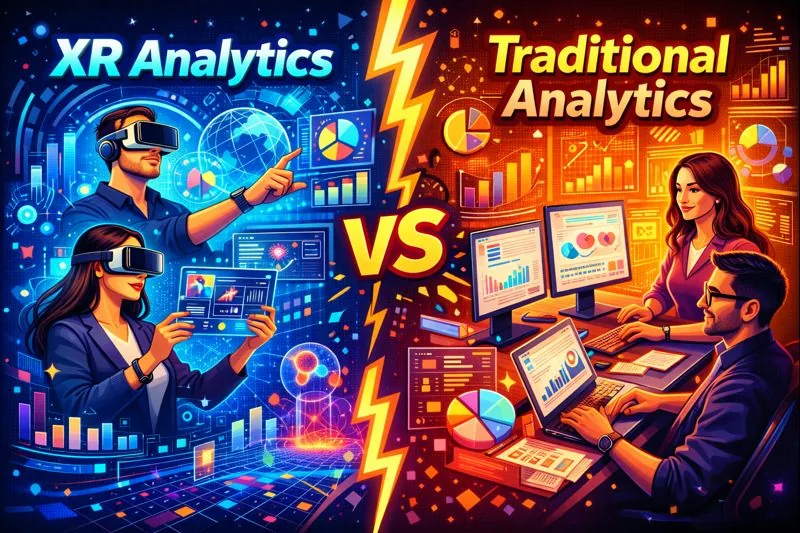
XR analytics measures how users move, look and interact inside immersive environments, while traditional analytics measures clicks, events and page views on flat interfaces.
Both approaches aim to understand user behavior, but they are built on fundamentally different assumptions. When experiences move from screens to space, analytics must evolve accordingly.
For a foundational definition of immersive analytics, see What is Immersive Analytics
How Traditional Analytics Works
Traditional analytics was designed for websites and mobile apps where:
- interfaces are screen-based,
- interactions are linear,
- navigation follows predefined paths,
- intent is expressed through clicks, taps or form submissions.
Common metrics include:
- page views,
- events,
- funnels,
- conversions,
- session duration.
This model works well for flat interfaces.
It breaks down when users interact inside space.
Why XR Changes the Analytics Model
XR environments introduce behaviors that traditional analytics cannot capture.
In immersive experiences:
- users move freely instead of navigating pages,
- attention shifts continuously across the environment,
- interactions happen through body movement, gaze and proximity,
- friction appears as hesitation, confusion or discomfort, not failed clicks.
XR analytics exists because space itself becomes the interface.
What XR Analytics Measures Instead
XR analytics focuses on spatial and behavioral signals, including:
Movement paths
How users navigate environments and where they hesitate or backtrack.
Gaze and visual focus
What users look at, what they miss and what captures attention.
Proximity and distance
How users position themselves relative to objects and interfaces.
Interaction behavior
Which elements are used intuitively and which cause confusion.
Behavioral patterns over time
Repeated actions that indicate learning, frustration or stress.
A practical explanation of how these signals are captured can be found in How to Measure User Behavior in XR & Games
Core Differences at a Glance
| Traditional Analytics | XR Analytics |
|---|---|
| Clicks and events | Spatial behavior and signals |
| Page-based | Environment-based |
| Linear user flows | Non-linear exploration |
| Assumes intent | Observes intent |
| Optimized for screens | Designed for immersive environments |
| Limited insight into comfort | Measures friction and usability in space |
XR analytics does not replace traditional analytics.
It complements it by measuring what traditional tools cannot see.
Why Traditional Metrics Are Insufficient in XR
Metrics like:
- bounce rate,
- time on page,
- click-through rate,
do not explain:
- why users feel lost,
- why they hesitate before interacting,
- why an experience feels uncomfortable,
- why training outcomes vary between users.
XR analytics addresses these blind spots by focusing on behavior in context, not abstract events.
The Role of AI in XR Analytics
XR analytics generates large volumes of spatial data.
AI is required to:
- detect behavioral patterns across sessions,
- identify friction points automatically,
- compare environments, versions or user segments,
- translate raw signals into human-readable insights.
This interpretive layer is known as AI-first analytics, explained in detail in AI-First Analytics: From Signals to Decisions
The objective is not data collection.
It is decision support.
When to Use Each Approach
Use traditional analytics when:
- measuring conversions and funnels,
- tracking marketing performance,
- analyzing flat UI interactions.
Use XR analytics when:
- designing immersive experiences,
- validating spatial UX decisions,
- improving comfort and accessibility,
- optimizing training and simulations,
- understanding real user behavior in space.
Most mature teams use both, each where it makes sense.
XR Analytics with Gossip
Gossip Analytics is designed specifically for immersive and interactive environments.
It captures spatial behavior and translates it into clear visual narratives that teams can use to improve experience quality, usability and performance.
For teams comparing platforms and approaches, see Gossip Analytics vs XR Analytics Tools
XR analytics is not about replacing existing tools.
It is about measuring what truly matters in immersive experiences.
Frequently Asked Questions
Related concepts
What is Immersive Analytics
The foundational definition and scope of immersive analytics.
How to Measure User Behavior in XR & Games
Methods and signals used to understand behavior in space.
AI-First Analytics: From Signals to Decisions
How AI transforms spatial data into insights.
Gossip Analytics vs XR Analytics Tools
A structured comparison of immersive analytics platforms.